GPU inference / AWS EKS / Open source
A reasoning model on a GPU that arrives on demand.
An end-to-end field build for serving DeepSeek-R1-Distill-Qwen-7B on AWS EKS. Pod demand creates GPU capacity, vLLM exposes an ordinary API, and telemetry ships with the platform.
- 01ClientGradio + OpenAI SDK
- 02ServiceClusterIP / port 8000
- 03RuntimevLLM OpenAI API
- 04ComputeL4 GPU / Karpenter
47 resources
Added in the recorded Terraform apply~5 minutes
Reported model download and GPU load16K tokens
Configured maximum model context$0.34-0.50 / hour
README estimate for the lab envelopeOperating premise
The GPU should be a consequence of demand.
Most model demos begin with an expensive machine already running. This one begins with a schedulable contract. Fargate keeps the minimum cluster services alive; Karpenter sees the pending GPU pod, selects available capacity, and removes empty nodes after the work is gone.
System map
A request becomes infrastructure.
The serving path stays small. The supporting control loops do the difficult work: bootstrapping, matching hardware, loading model state, and observing every token.
Client
Gradio + OpenAI SDK
Service
ClusterIP / port 8000
Runtime
vLLM OpenAI API
Compute
L4 GPU / Karpenter
Foundation
Terraform creates the VPC, two-AZ EKS cluster, private subnets, and AWS integrations.
Bootstrap
Fargate runs CoreDNS and Karpenter before any EC2 worker capacity exists.
Serving
Helm deploys vLLM with GPU requests, health probes, and memory-backed shared memory.
Visibility
A ServiceMonitor connects vLLM metrics to Prometheus and a checked-in Grafana dashboard.
Run evidence
Proof, not diagrams.
These are artifacts from the checked-in build: the apply, the cluster, the capacity controllers, and a response streamed through the deployed model.
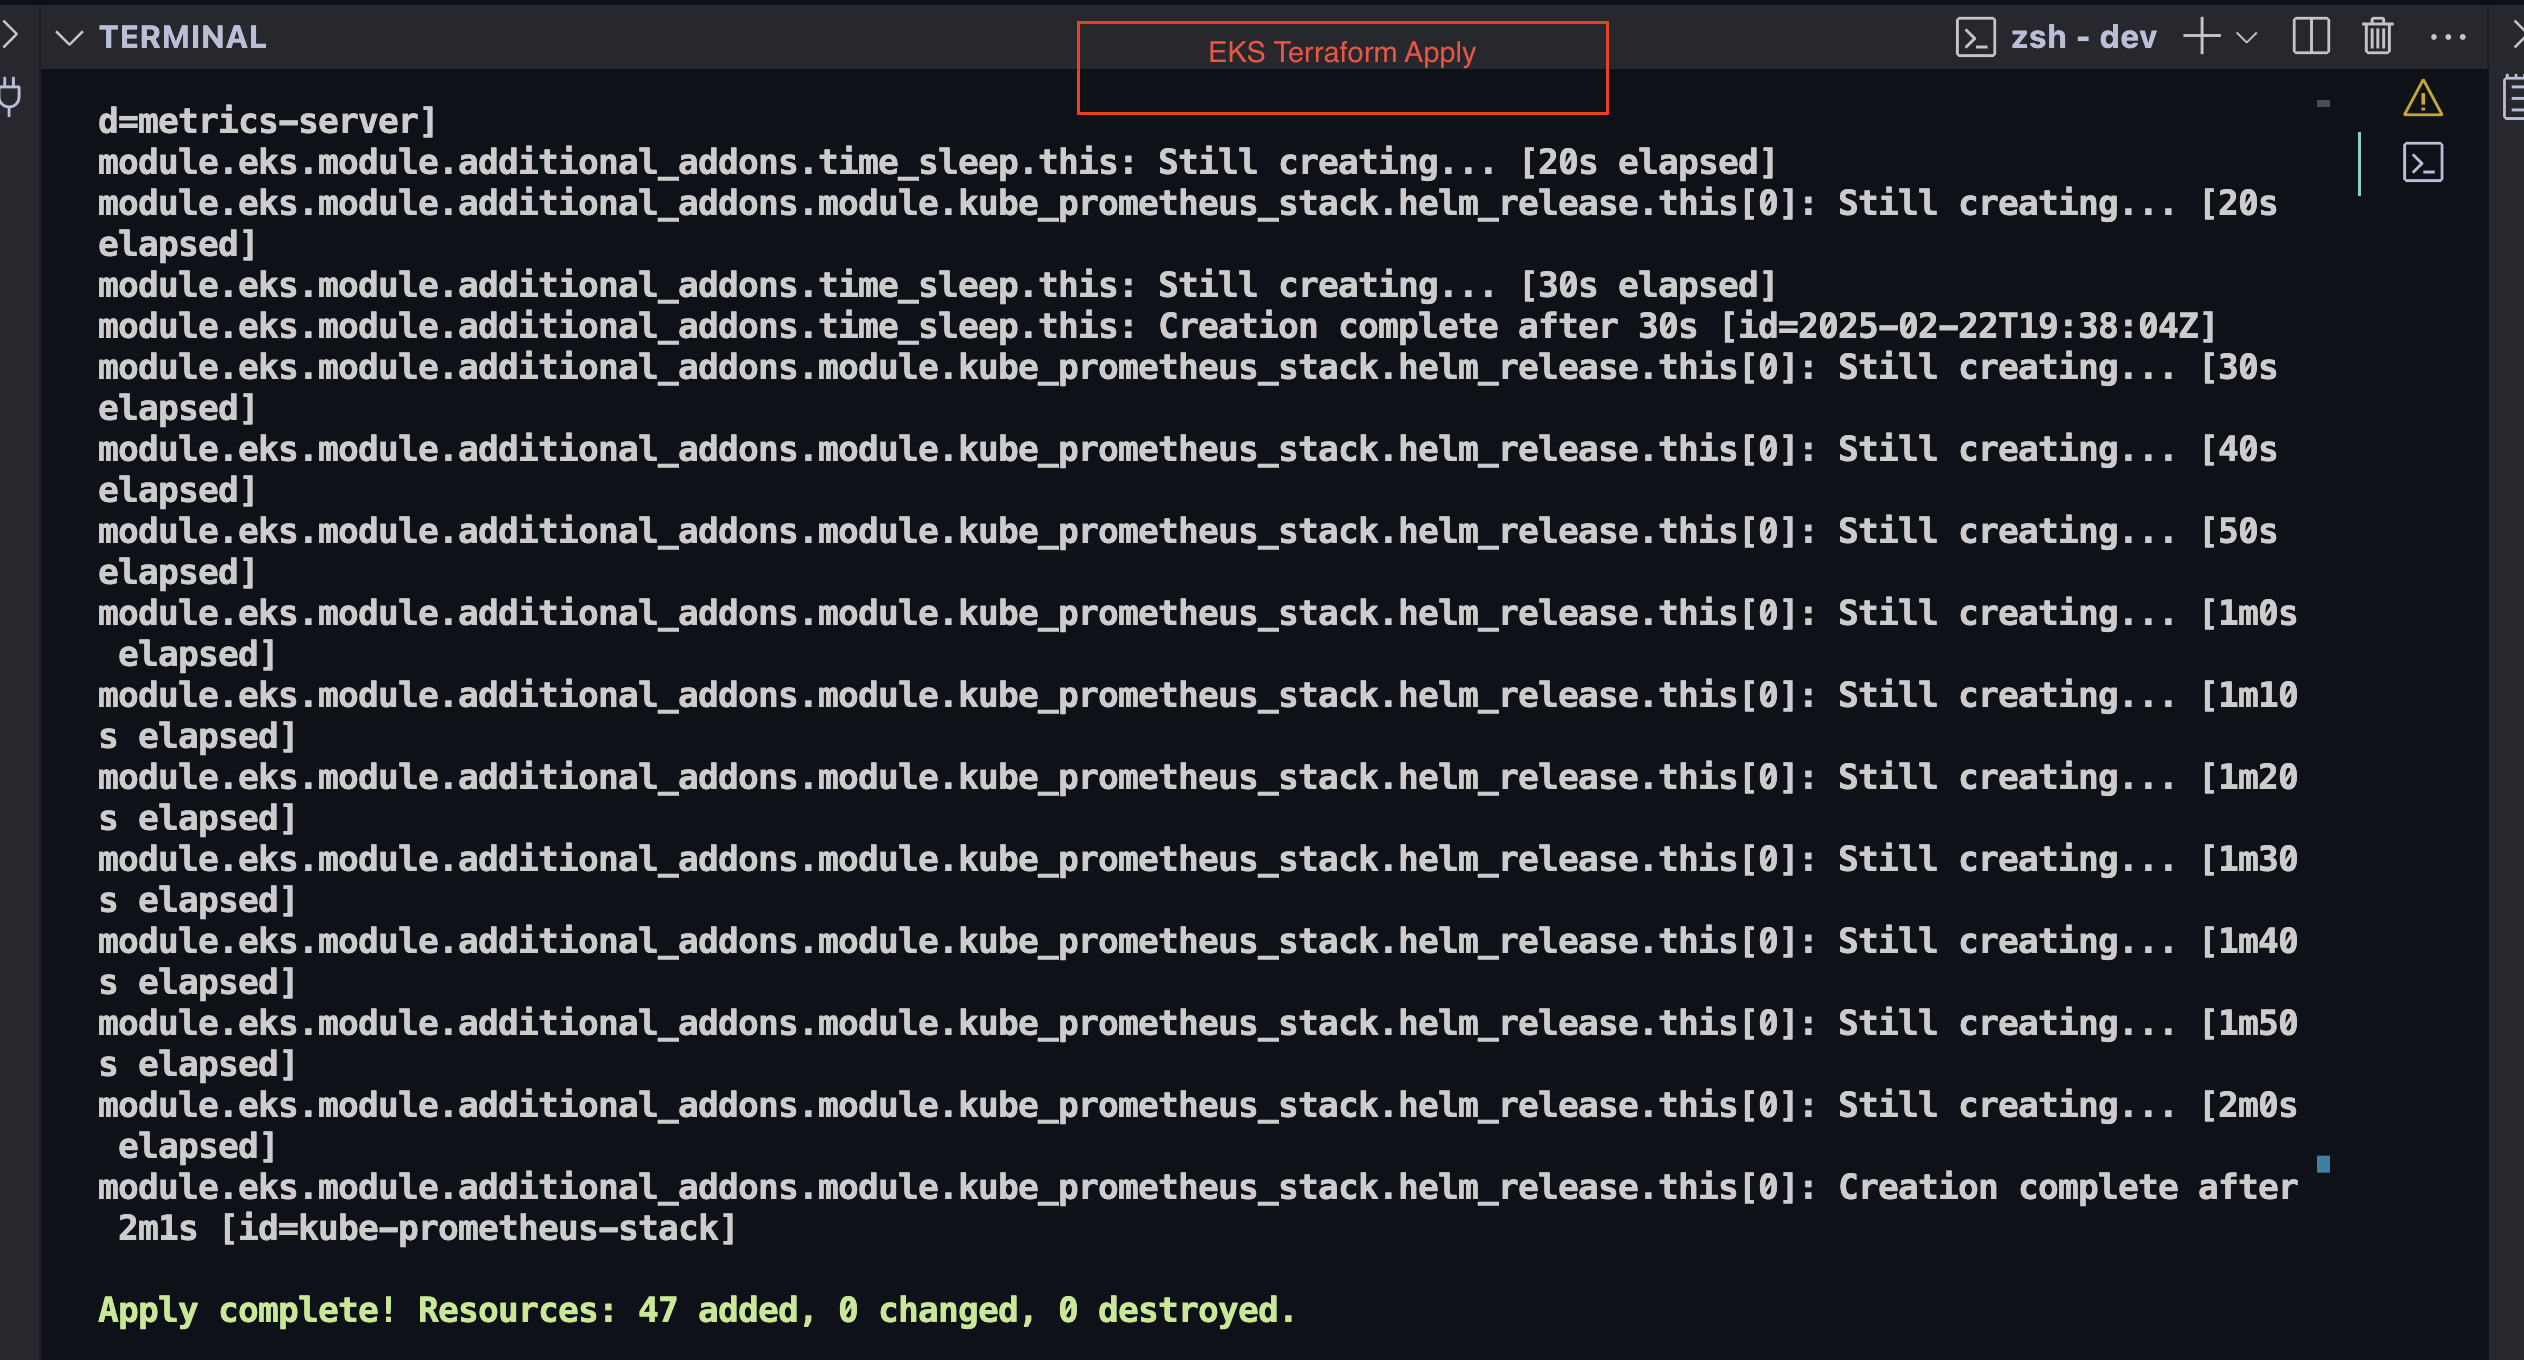
The recorded run completes with 47 resources added and no changes or destroys.
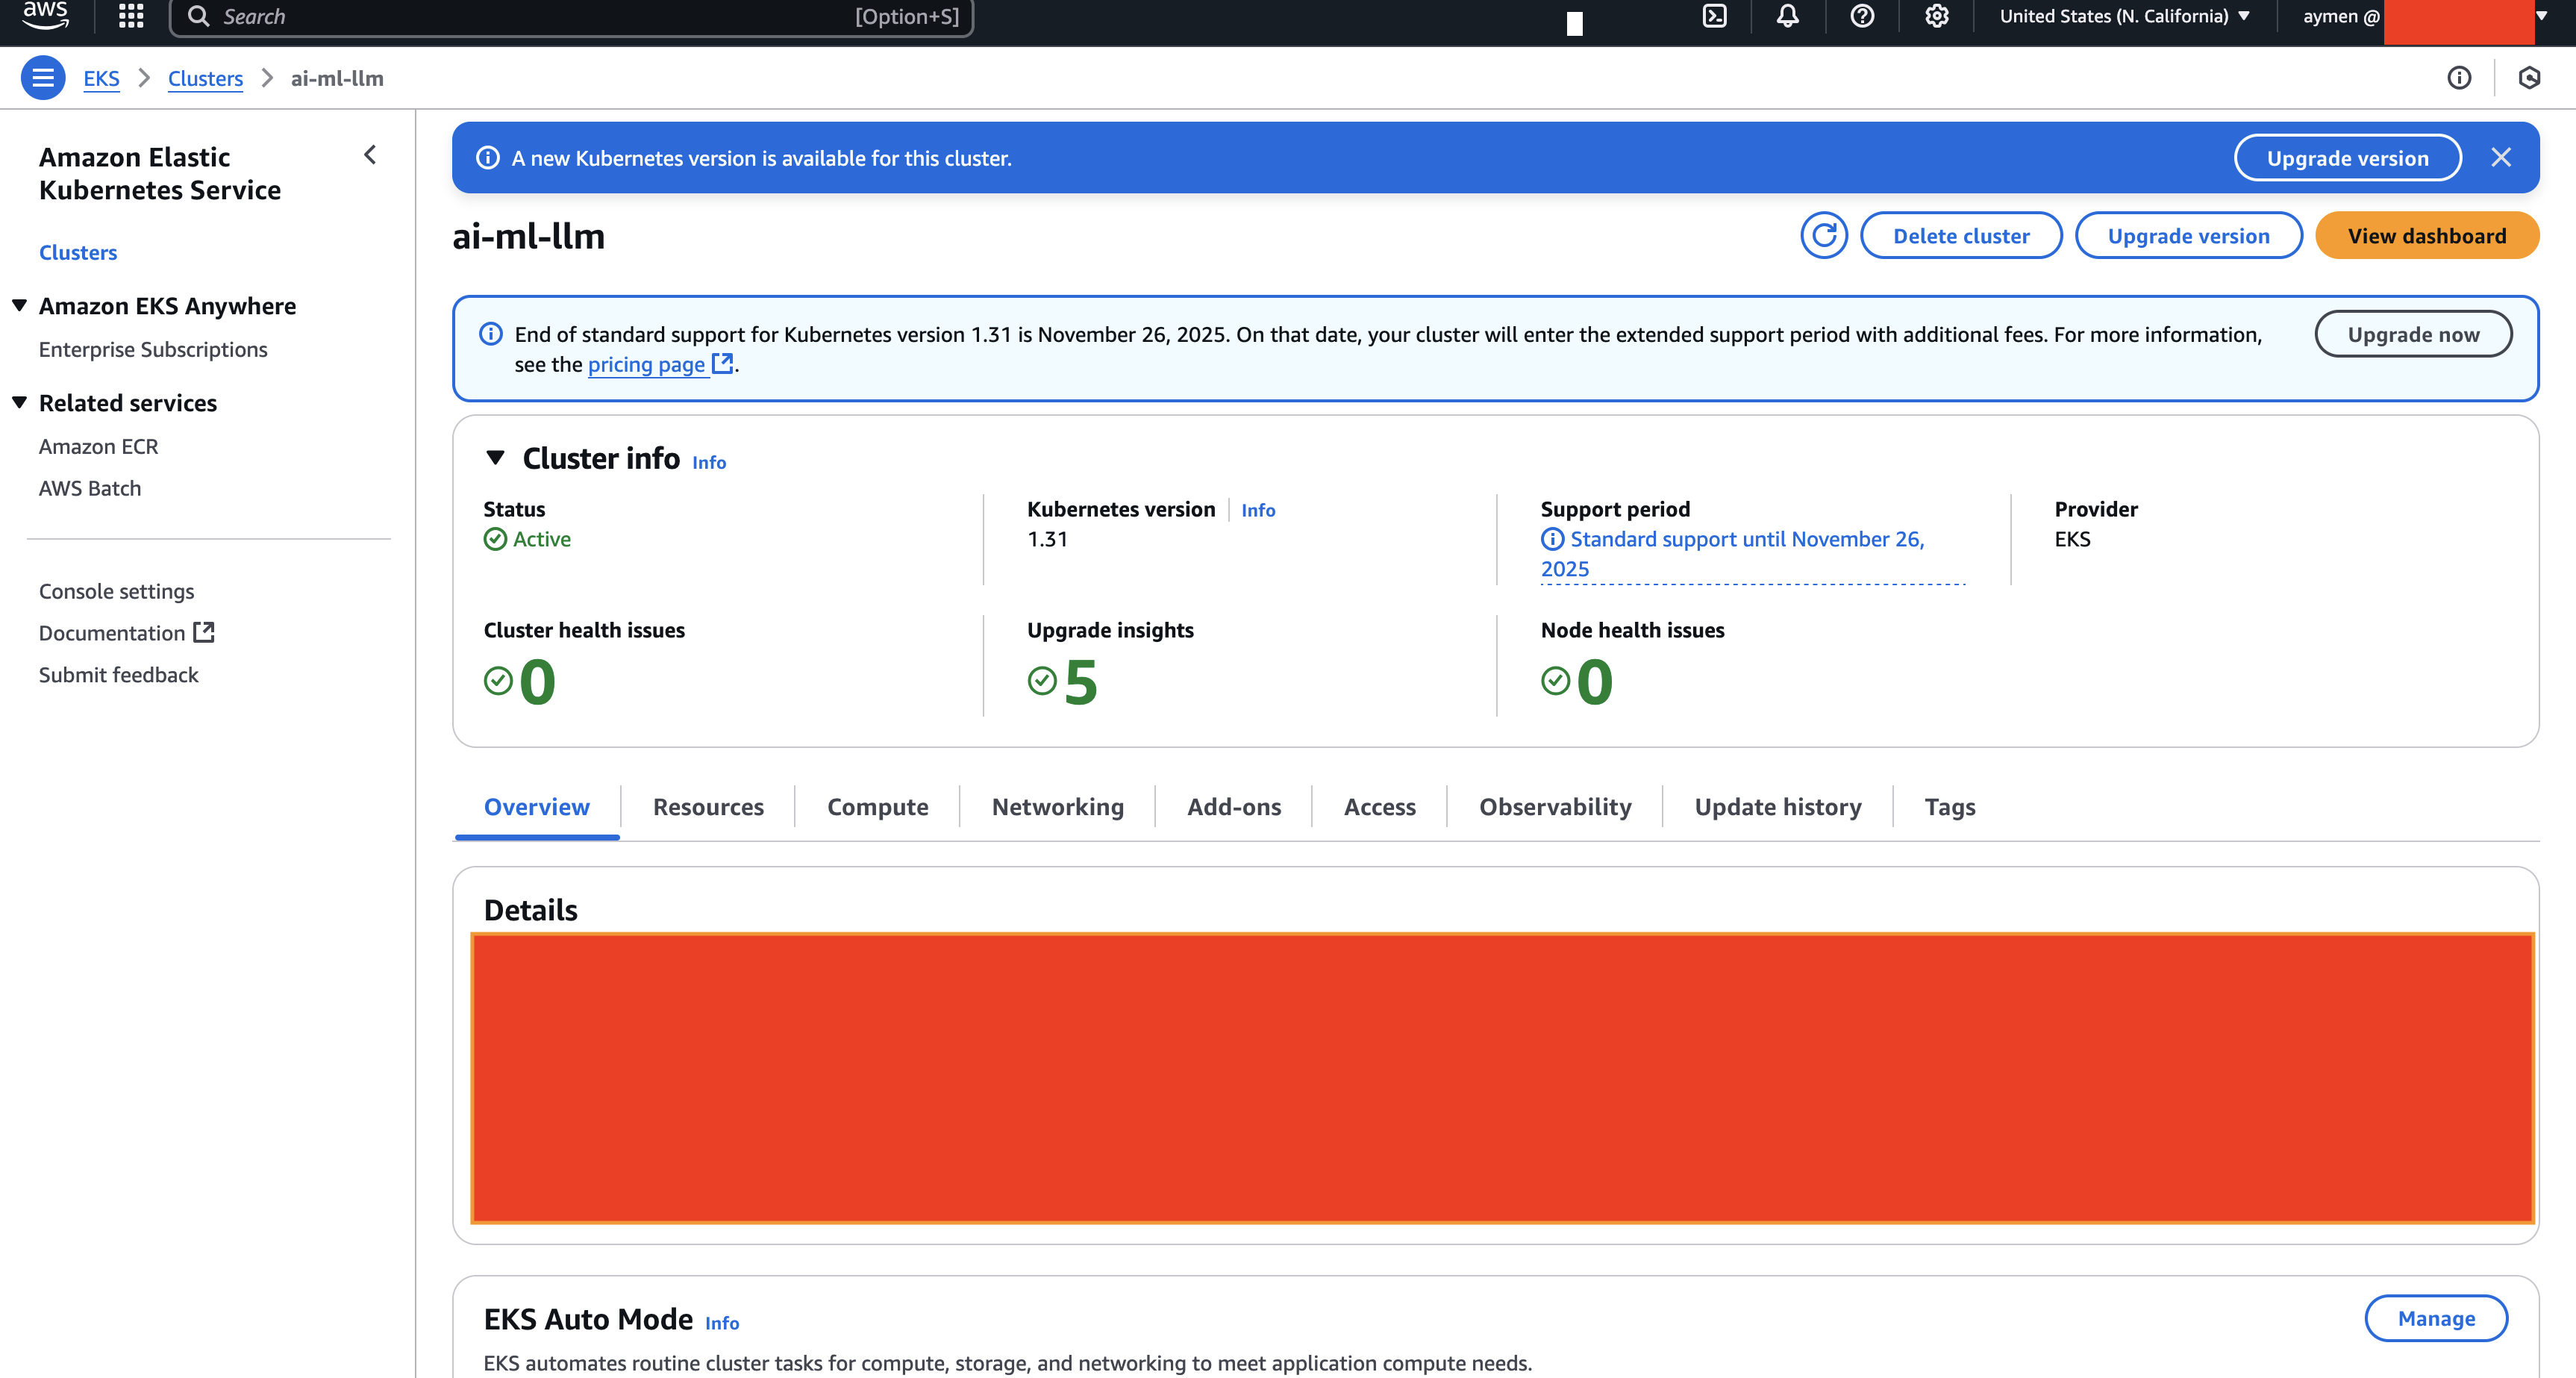
An active EKS 1.31 cluster, created as the substrate for model serving.
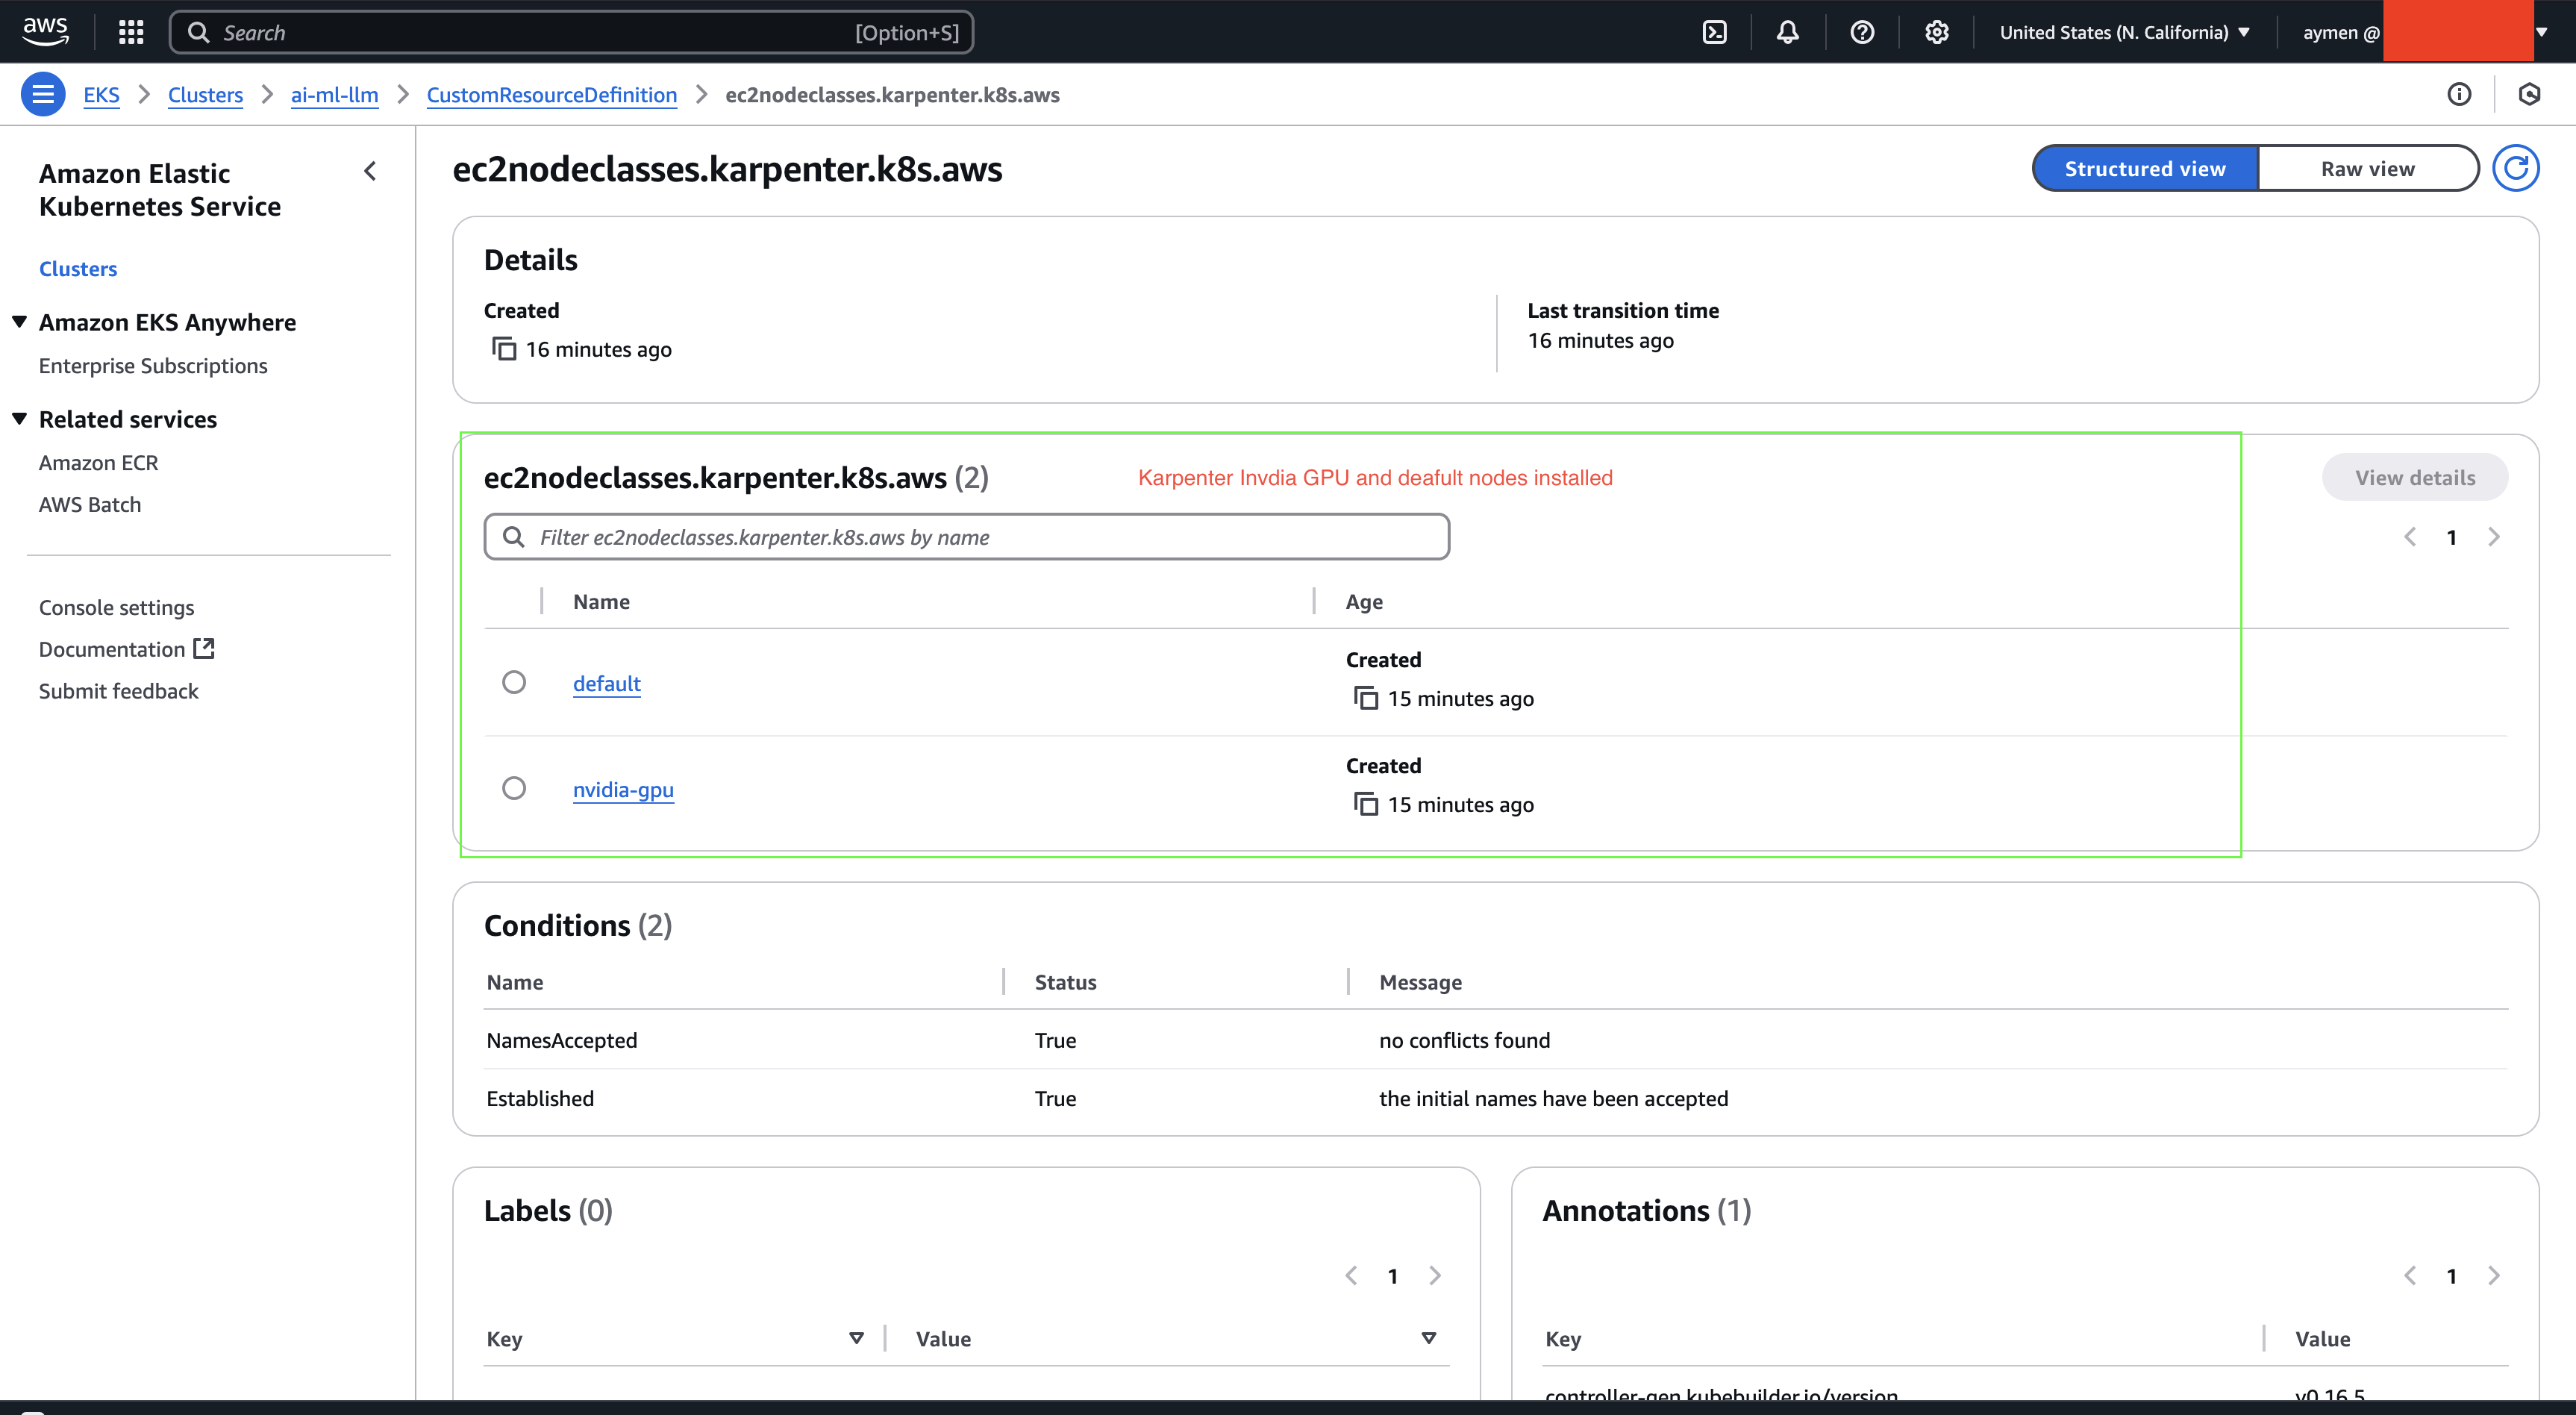
Both default and NVIDIA GPU capacity classes are installed in the cluster.
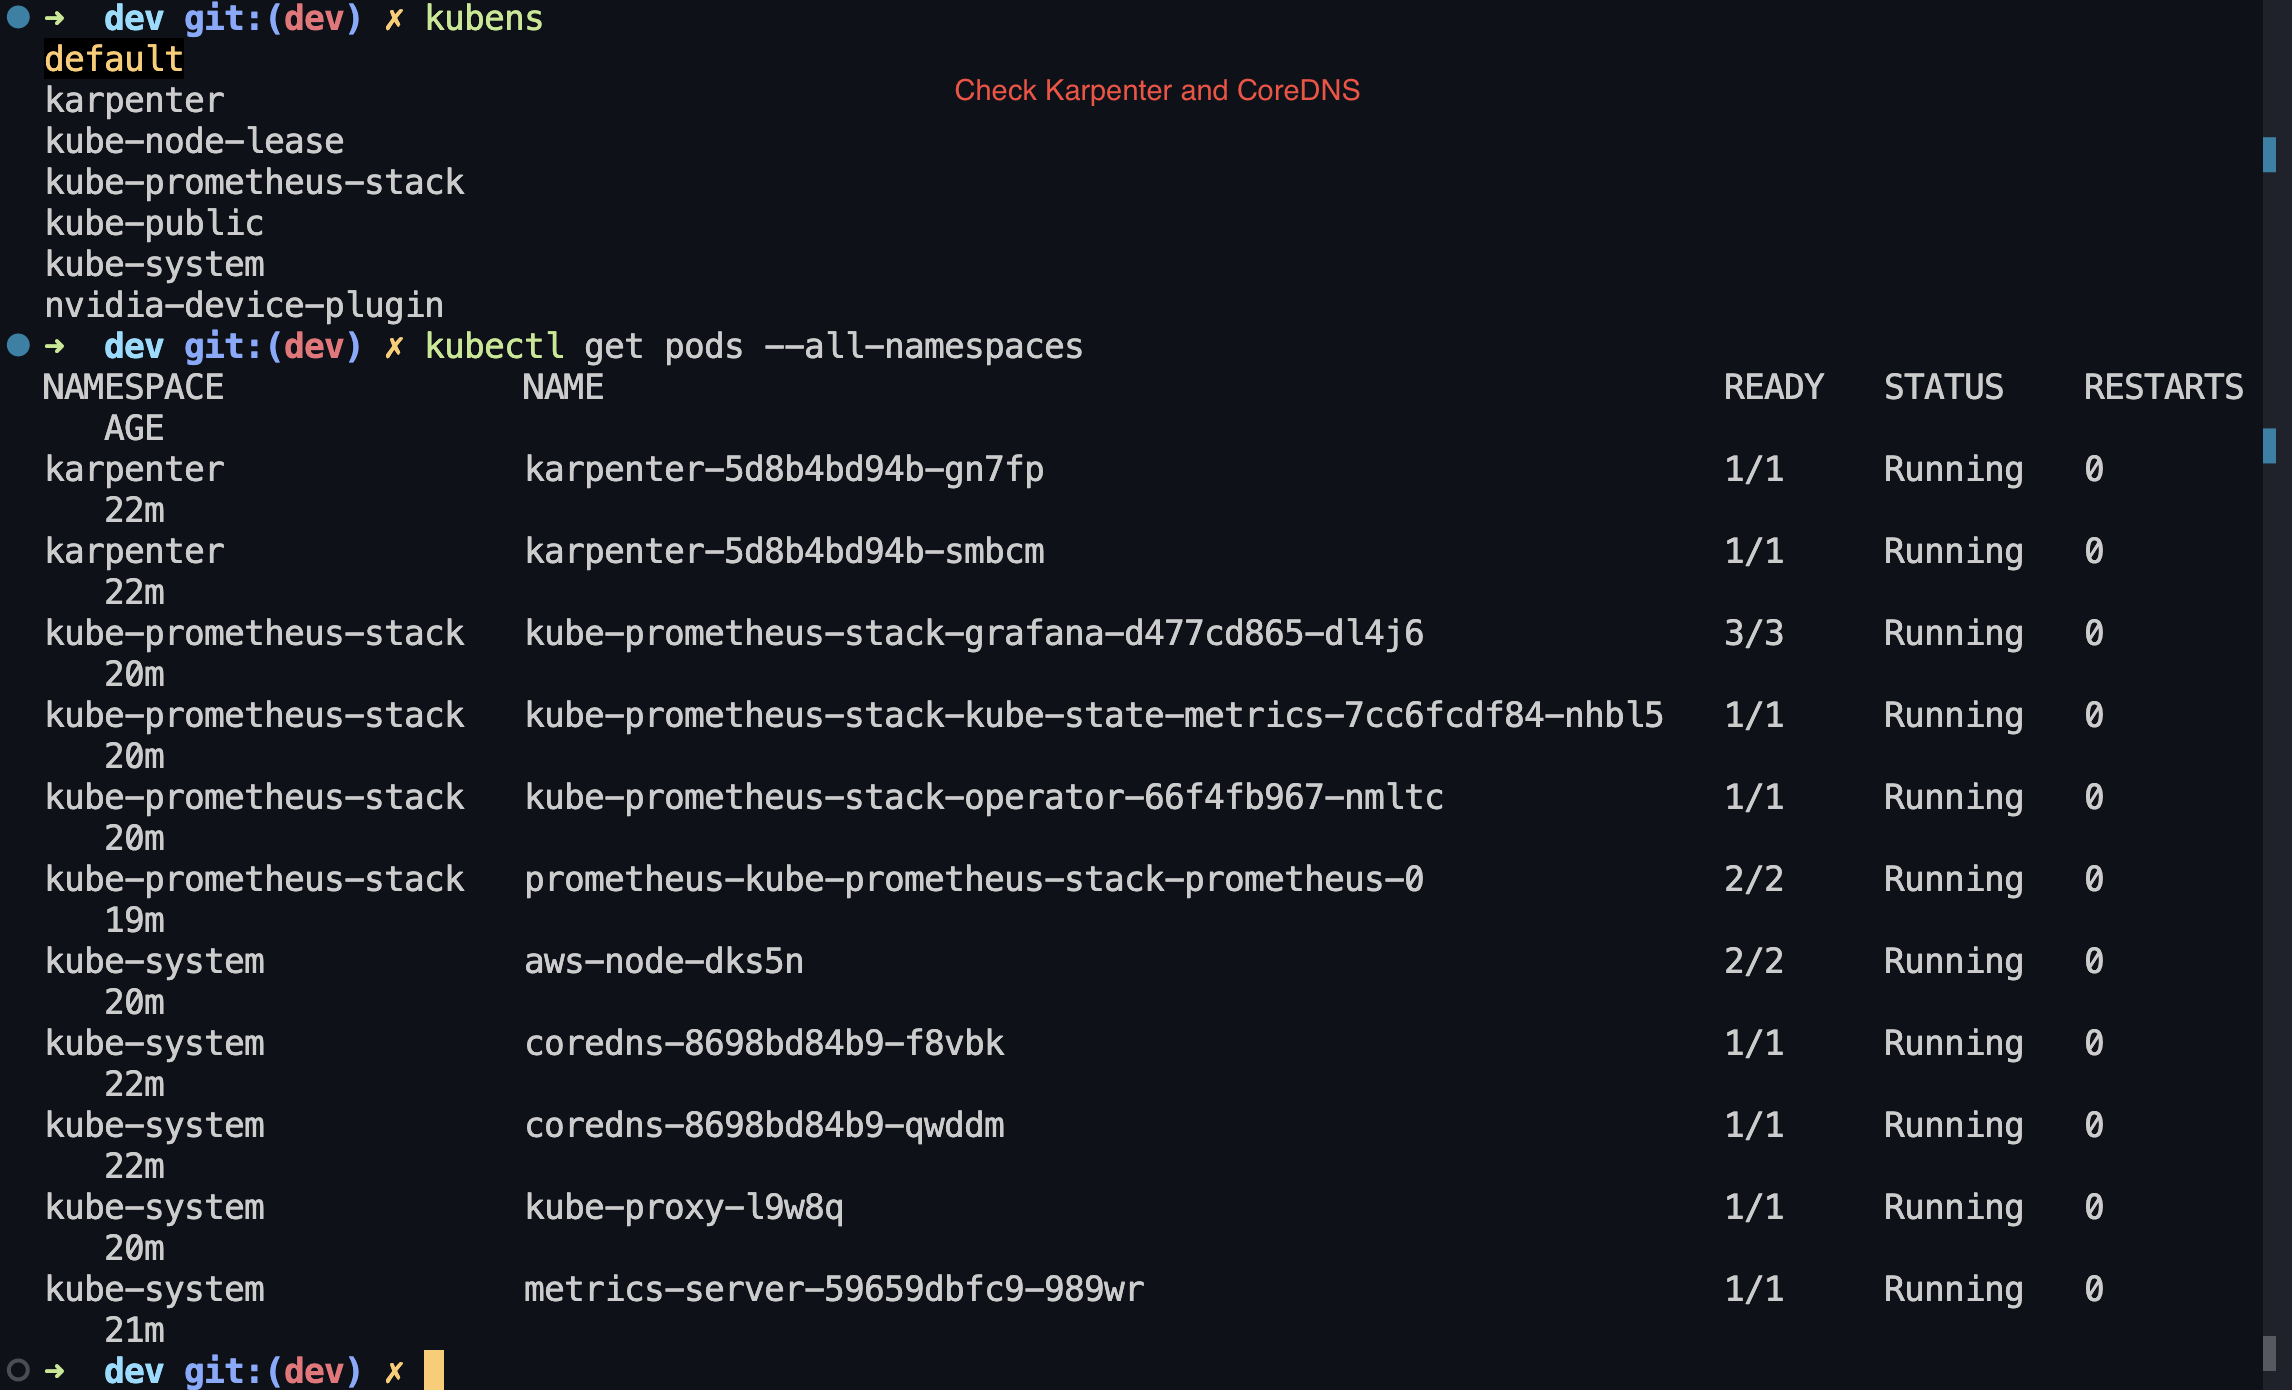
Karpenter, DNS, metrics, Prometheus, Grafana, and the device plugin share one build.

The OpenAI-compatible server is live on port 8000.
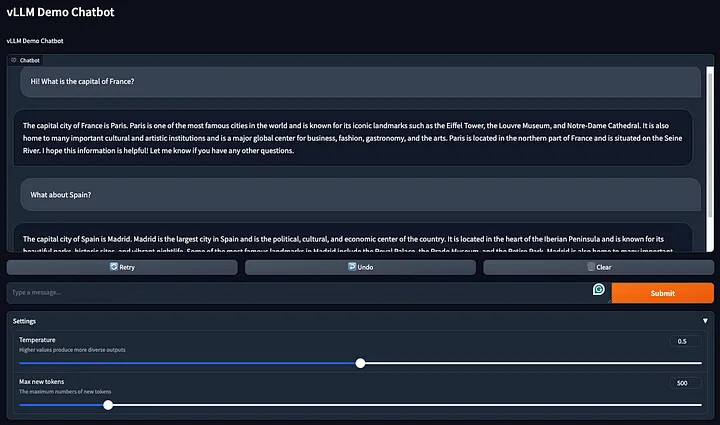
The Gradio client streams model output through the standard OpenAI Python client.
Engineering decisions
Small contracts, joined end to end.
No single component makes the system useful. The value is in the contracts between bootstrap capacity, scheduling, serving, and telemetry.
One request connects software intent to physical capacity.
The pod does not know an EC2 instance ID. It declares a GPU resource and tolerates the isolated pool; Karpenter resolves that contract against available AWS supply.
nodeSelector:
  instanceType: gpu
tolerations:
  - key: nvidia.com/gpu
    effect: NoSchedule
resources:
  requests:
    nvidia.com/gpu: 1
args:
  - --model=deepseek-ai/DeepSeek-R1-Distill-Qwen-7B
- --max-model-len=16000- D1
Bootstrap without a node group
CoreDNS and Karpenter run on Fargate. The capacity controller is therefore alive before the first application node is requested.
EKS module / fargate_profiles - D2
Treat GPU capacity as schedulable supply
The GPU pool accepts g4dn, g5, g6, g6e, p4, and p5 families across spot and on-demand capacity, rather than pinning one scarce SKU.
Karpenter / nvidia-gpu NodePool - D3
Make the pod declare the hardware contract
A node label, NoSchedule taint, matching toleration, and one nvidia.com/gpu request connect model demand to the GPU pool.
Helm Deployment / resources + scheduling - D4
Keep the inference interface ordinary
vLLM exposes an OpenAI-compatible endpoint, so the client uses the standard OpenAI SDK and streams tokens without a custom protocol.
genai-app/app.py / stream=True - D5
Budget for model startup
Readiness, liveness, and startup probes separate a long model load from a failed server. The startup window allows up to 15 minutes.
Helm Deployment / startupProbe - D6
Install telemetry with the platform
Prometheus, Grafana, metrics-server, and the NVIDIA device plugin are cluster add-ons, not a monitoring task deferred until after inference works.
EKS Blueprints Addons / addons.tf
Serving signals
Instrument the user wait.
GPU utilization alone cannot explain how inference feels. The dashboard is shaped around the latency and throughput signals that expose the actual serving path.
- 01
Time to first token
The user-visible wait between submitting a request and seeing generation begin.
- 02
Time per output token
The decode cadence after the first token, where a response can still feel slow.
- 03
Prompt + generation rate
Token throughput for understanding saturation and effective serving capacity.
Scope note: the repository contains the ServiceMonitor and Grafana dashboard. It does not publish benchmark results, so this page does not invent them.
Production boundary
A field build with clear edges.
This repository proves the serving path. It is not presented as a drop-in production platform. The distinction is part of the engineering record.
- 01
Access
The EKS control-plane endpoint is public and inference is reached through local port-forwarding. There is no ingress authentication, TLS policy, or network policy in the repository.
- 02
Availability
The model runs as one replica with no disruption budget or model-level autoscaler. Karpenter supplies nodes; it does not scale inference replicas.
- 03
Reproducibility gaps
Before reuse, the Terraform config filename and README launcher command need alignment, and the manifests need automated validation in CI.
- 04
Economics
The hourly range is a README estimate, not a measured benchmark. Region, spot availability, NAT traffic, idle time, and model size all move the result.